Our Latest Stats
See below our latest web, search and social media stats for -
October School Holidays 2024 - 01 September to 13 October 2024 - 42 days
Over this time period our Linku2 School Holidays site had the following stats -
Web Stats
Website Page
Views
32,370
(2,426 to paying advertiser pages - 11 client pages)
Engaged Sessions
15,063
An engaged session is when a site visitor takes an action on a page (eg, click, scroll ...)
External clicks to advertiser websites
198
Note: Our target for advertisers is that they only need on average ONE booking for a 100% Return on Investment (ROI).
This is our 10th consecutive growth period.
____________________________________________________________________
Advertiser site page views (11 pages)
2,426
Over the 42 day period our specific advertiser site pages (11 pages) and top level pages with their linked logo adverts recorded 67,763 events (an event is a click through to an advertisers website, downloading a file, page scroll, form completion or any other engagement a user has with that page).
____________________________________________________________________
Google Search Stats
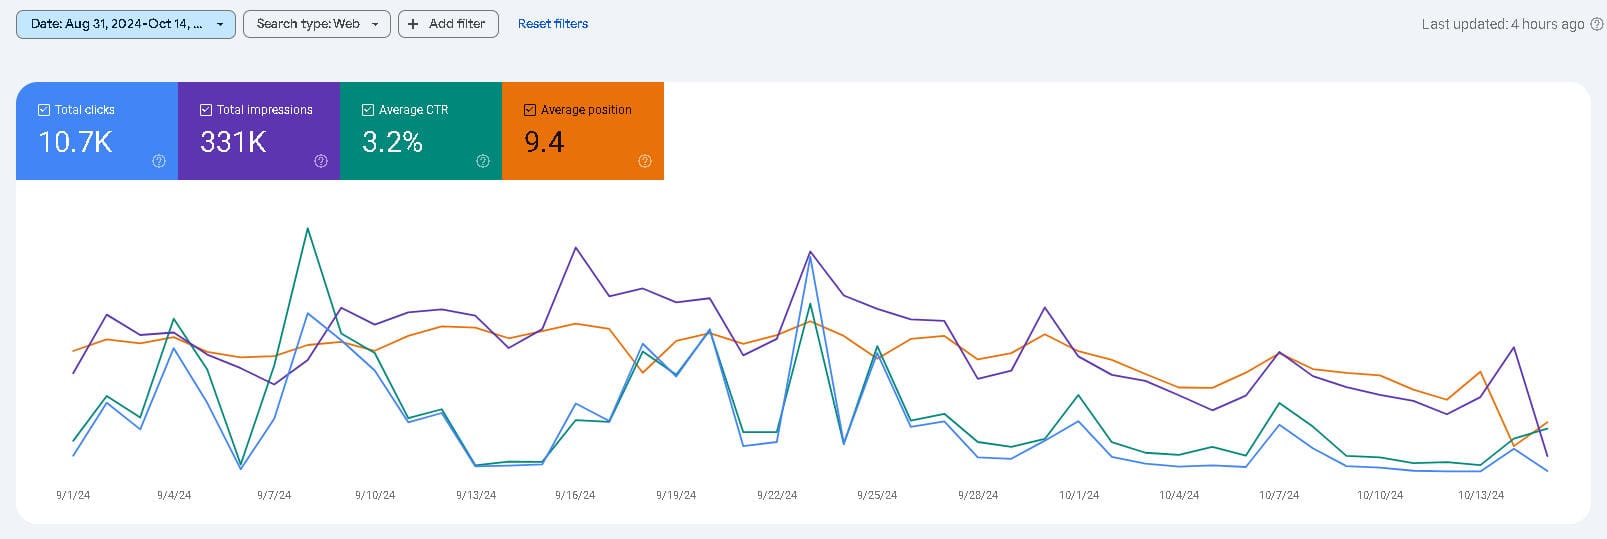
Google Search Impressions
331K
Google Search Click throughs
10.7K
Our site pages had an average Google page ranking of 9.4 (over 476 pages)

Google Search Stats
Best Day for Impressions: 16 September - 12,936
Best Day for click throughs: 23 Seotenber - 993 click throughs
Mobile Usability: 100%
Our Reach
Whilst we have a good reach through our social media posting Google organic search remains our largest share of our visitor market with -
86.2% of our visitors coming through Google organic searching
7.3% of our visitors coming through direct interaction with our site
Balance of site visitors through our organic social posting or from referrals
The average user engagement rate with our pages and information provided is 91.63%
Averages
The above stats work out as an average stats each day of -
- 641 site pages visited each day by 278 site visitors (11 advertiser pages viewed each day of promotion)
- 7,880 Google impressions each day with an average of 254 click throughs
This is for every day of our holiday promotion
____________________________________________________________________
Social Media Stats - Facebook
Social Media Impressions
29,952
This is an average reach of 670 for each day. Our team share our advertiser posts across groups in their focus region
Social Media Click Throughs
393
Facebook sharing -
Our team share client page posts across over 408 groups across New Zealand
We posted 24 posts for our 11 advertiser pages over the 42 day period and shared these posts 458 times
On the Hibiscus Coast and North Shore we manage groups with over 100,000 followers
Each client had 3 shared posts with an average reach per client of over 3,490 Facebook followers
Prize Draw and Newsletter Stats
School Holiday Prize Draw Entries -
197 Entries
Newsletter Reach -
3 newsletters - No of Contacts: 3,205 site users
Note newsletters are targeted to specific regions for relevance for our families driving them to their local holiday activities
Region Specific Stats
North Shore and Hibiscus Coast Region (5 clients)
Website Page
Views
2,426
(Pages with full client links, programme/activity details and direct to client pages)
External clicks to advertiser websites
197
(This is an average of 46.8 clicks to each client website)
Google Search Impressions
Our North Shore and Hibiscus Coast pages and client pages with full client links and programme/activity information appeared in Google Searches -
- 5,900 impressions with
- 162 direct click throughs to details
Region Specific Stats
Hamilton Region (3 clients)
Website Page
Views
894
(Pages with full client links, programme/activity details and direct to client pages)
External clicks to advertiser websites
18
(To ONE key client only)
Google Search Impressions
Our Hamilton pages and client pages with full client links and programme/activity information appeared in Google Searches -
- 5,191 impressions with
- 134 direct click throughs to details


